Using Log Analytics to Generate Alerts for Each New Intune Device Enrollment
March 20, 2020 3 Comments
This is part 1 in the scenario Perform Automation Based on Device Enrollment in Microsoft Intune.
This post describes how to trigger an Azure Monitor alert based on a Device Enrollment event in Microsoft Intune.
Why would I want to do such a thing?
Oh, let me count the reasons! Event-triggered actions are very powerful. Typically when you think of an ‘alert’, it’s probably because something bad happened (think of a monitoring alert for low disk space, for example). For this post, we’re going to create an alert based on the desired event, device enrollment. There are many scenarios where an IT admin wants to know when a device is actually enrolled in order to follow up with the user, mark a request as complete, or just ensure that devices are being properly managed.
Here’s an image of what we will accomplish in this post:

So to break down these steps:
- User enrolls device
- Device registers with Azure AD and Intune
- Intune sends “OperationalLogs” message to Log Analytics
- Log Analytics query criteria are met and send an event to Azure Alerts
And that’s the logical process in a nutshell! Now, let’s get into the details for HOW to make that happen.
Prerequisites
To perform the configuration steps, you must have a Microsoft Intune Environment and a Log Analytics workspace in Azure. And to test, you’ll need a device to enroll.
Configure Intune Diagnostic Settings
- In the Azure portal, navigate to Microsoft Intune.
- In the Monitoring section, select Diagnostic Settings and then select Add diagnostic setting (Figure 2).
- In the Diagnostic Settings dialog, enter a descriptive Diagnostic settings name, and select OperationalLogs (Figure 3).
- Under Destination details, select Send to Log Analytics. Choose your desired subscription and workspace (Figure 3).
- Click to Save the Diagnostics settings.


Operational logs (OperationalLogs) show the success or failure of users and devices that enroll in Intune, as well as details on non-compliant devices. For our scenario, we will filter the Operational Logs for device enrollment.
Test Diagnostics Sent to Log Analytics!
To test:
- Enroll a fresh device to Intune.
- Verify the device is visible in the All Devices node in Intune.
- Once the node is visible, launch Log Analytics and open the workspace selected in Figure 3.
- Search Tables for IntuneOperationalLogs (Figure 4) and then double-click it so that it appears in the query frame.
- Select IntuneOperationalLogs and then click Run.
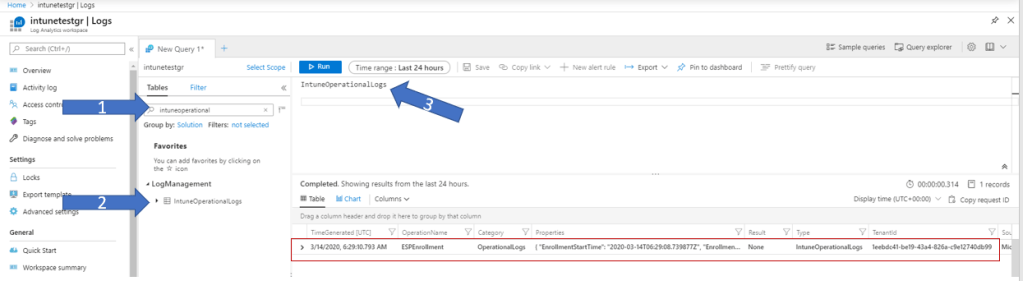
Sometimes it may take up to ten minutes from the time you see the device in Intune until the time you will see it in Log Analytics, but in general, this happens fairly fast.
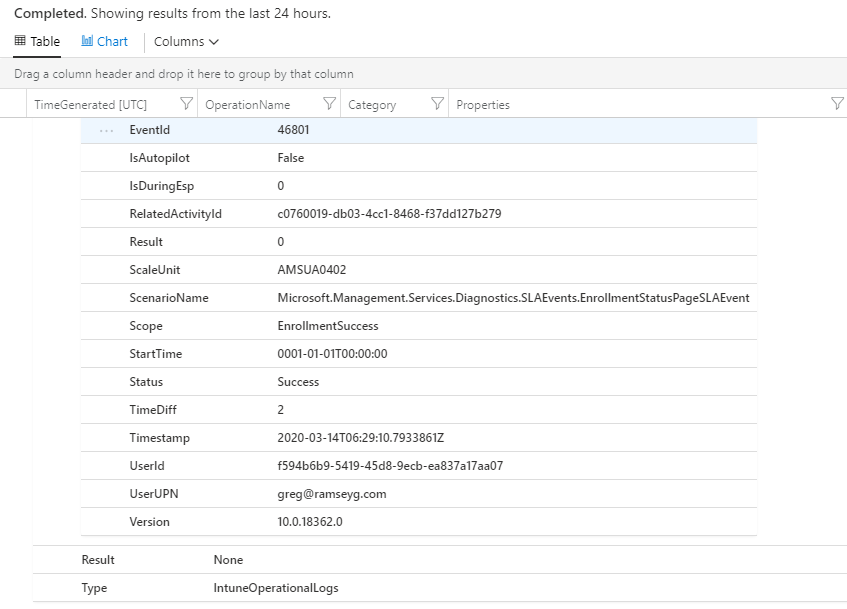
Expand the result, and expand the Properties section to view device-specific details, as shown in Figure 5.

As you can see in Figure 5, we can see this is an enrollment message. Scroll down the page to see the additional properties, as shown in Figure 6.
Create an Azure Alert
Now that we have the data in Log Analytics, we can easily generate an alert. We’re going to create an alert rule so that any time a new record appears that meets our criteria, an alert will be triggered.
First, update the Log Analytics query criteria in Figure 4.0 to the following:
IntuneOperationalLogs | where OperationName == 'ESPEnrollment' and Category == 'OperationalLogs'
This query will help us filter so that we only generate alerts for device enrollment. Go ahead and Run the query to verify the results.

Highlight the query and select New alert rule as shown in Figure 7.

From Figure 8, you can see the connected Log Analytics instance, as well as other configuration information. Notice that the Condition requires additional information. Click on the highlighted text that reads ‘Whenever the custom log search is greater than…..’ and review the following settings, as shown in Figure 9.
- Add the following Search query:
IntuneOperationalLogs | where OperationName == 'ESPEnrollment' and Category == 'OperationalLogs'
- Under Alert logic, configure as shown in Figure 9.
- Under Evaluated based on, configure as shown in Figure 9. This sets the rule to evaluate every five minutes, based on the last five minutes.
- Verify settings and click Done.

To complete the Alert Rule, add an Alert rule name called New Device Enrolled and set the Severity to Sev 4, as shown in Figure 10. Then click Create alert rule.

Congratulations! You have successfully created an alert rule based on a filter in Log Analytics! Please proceed to Create a Webhook from Azure Alerts to a Logic App.
Review the Scenario: Perform Automation Based on Device Enrollment in Microsoft Intune
Greg


