Client Health – More than Just Percentages
November 10, 2017 1 Comment
I recently had the pleasure of presenting a session on ConfigMgr client heath at IT/DevConnections with my friend Kent Agerlund, and wanted to reiterate one of the items we mentioned during the session. Measuring health by percentage is a great thing, but you should also look at the numbers too. Below is a pic of an example SSRS report that I created.
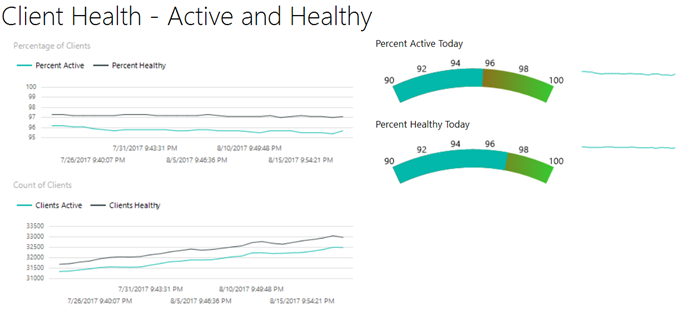
On the left-hand side, you see the top graph is percentage of health from 7/31-8/15 – that’s great – you can see we ran around 97%. . . but what is even more fantastic is that during that same period, we went from 31K systems to 33K systems and maintained health. This is a good thing, but what is even more important (but not shown above) is to watch those numbers for a large reduction in systems. If you’re only looking at percentages, your health may look the same, event though someone went into your admin console and ‘accidentally’ deleted 5K systems. . . . so percentages are great, but take a look at the numbers too.
Greg
Here is the SQL used for the reports above – just update the SiteCode and desired CollectionID.
SELECT  [Date]
      ,[CollectionID]
      ,[SiteCode]
	  ,ROUND([ClientsActive] * 100.1 / [ClientsTotal], 1) AS PercentActive
	  ,[ClientsActive]
	  ,ROUND([ClientsHealthy] * 100.1 / [ClientsTotal], 1) AS PercentHealthy
	  ,[ClientsHealthy]
  FROM [v_CH_ClientSummaryHistory]
  where [Clientstotal] > 0 and datediff(day,[date],getdate()) <30 and SiteCode='GMR'
and CollectionID='SMS00001'
  order by date

Pingback: How: Build Client Health Trendline | Greg's Systems Management Blog